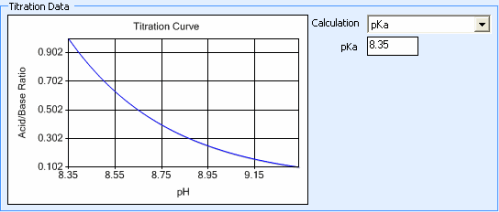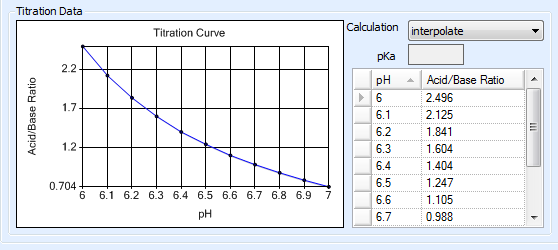
The Titration Curve reflects the changes in pH (X axis) that occur as the concentration ratio (Y axis) of the acid and base that make up a buffer is varied. This data is used to determine how the acid and base that make up a buffer are mixed in order to obtain a certain pH level.
By default, Rock Maker generates the titration curve using the Henderson-Hasselbalch equation, pH = pKa + log10 ([Base]/[Acid]). The pKa value used in this calculation is displayed in the pKa box. You can change this value for polyprotic buffers if necessary.

Titration Data
When dealing with polyprotic buffers that can have multiple pKa values, a more accurate titration curve can be achieved by manually entering pH measurements along with their corresponding acid-to-base ratios. You can obtain this data from a vendor or by using a pH meter to conduct your own measurements. Rock Maker interpolates the titration curve using the entered data points.
Note: Be sure to define enough data points to cover the range of all stocks that you will need to define in Rock Maker. For example, if you will need to create a stock with a pH of 8.0, make sure that pH level is represented on the curve. In the following example, we would be able to define stocks with pH levels from 2.6 to 7.
